Understanding how your customers react to your price and their world
When it comes to setting the price of your goods you need to be aware of two fundamentals of being in business: 1) Demand – why and how consumers want a product, and 2) Supply – why and how a producer sells a product.
The first thing to understand is how demand works.
Demand
Demand is both simple and complicated depending on how deeply you look into it.
At the simple level demand is the level of activity of a consumer to own a product or use a service. A consumer ‘demands’ a product to be supplied. if you are selling a product then there needs to be a demand for it otherwise no one will want it. You can give it away as a gift if you wish but that’s not a great business model.
For clarity demand is not an aggressive position. It’s not like Veruca Salt from Rohl Dahl’s Charlie and the Chocolate Factory i.e. “I demand a golden ticket”. Demand is a motivation to actually want a product and then willing to pay it (giving it away is the same as setting the price to zero (you can pay people to want the product but things get very weird at that point where a country is dealing with a deflation).
Law of Demand
Taking demand a step further we need to show how demand changes. If you understand how demand changes then you can change your pricing and control your costs to run a successful business (your costs are from you demanding from another business).
The law of demand is simple:
Law of Demand
As price goes down demand goes up
As price goes up demand goes down
Let’s use an example to show how this works. The product we’re going to use is a chocolate bar. We’ll talk about chocolate and other products and how customer demand changes under different conditions. For now we’re going to make up some numbers.
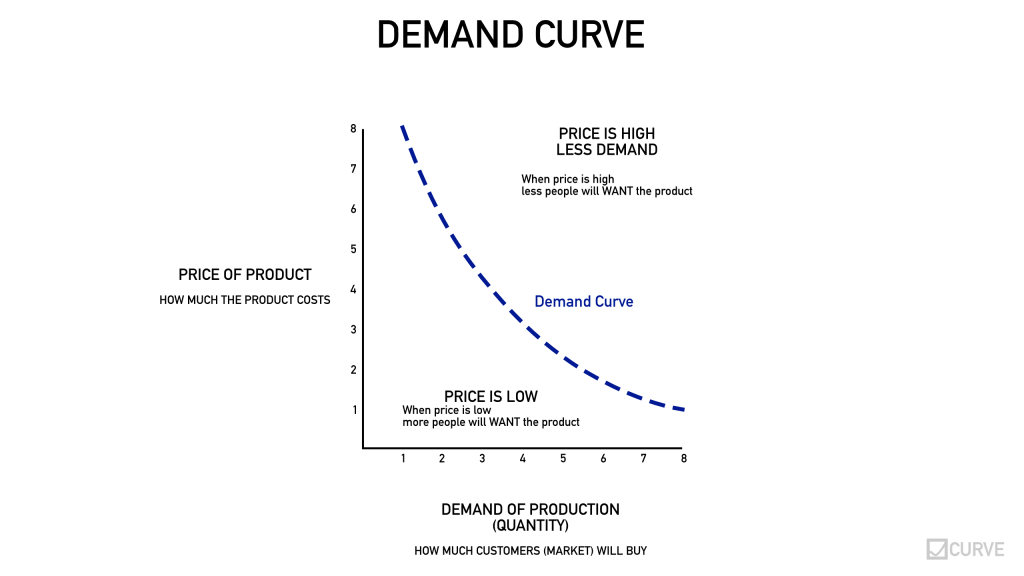
For our chocolate bar we priced at 8 different prices and measured the demand for the chocolate bar (t. This produced a demand curve.
| Price (£) | Demand (bars demanded) | Difference |
|---|---|---|
| 1 | 8 | N/A |
| 2 | 5.5 | 2.5 |
| 3 | 4.2 | 1.3 |
| 4 | 3.3 | 1.0 |
| 5 | 2.5 | 0.8 |
| 6 | 1.9 | 0.6 |
| 7 | 1.5 | 0.4 |
| 8 | 1.1 | 0.4 |
As you can see as the price increases demand decreases and vice versa. If we plot these results in a graph you can see the curve. Two things to notice on the demand curve:
- The curve goes down or it’s a negative curve
- It’s not straight – the line is steeper at the top than at the bottom
FUN FACT
Demand curves can be drawn straight to simplify the relationship between different curves as copying a straight line is easier than copying a curved line.

Three Factors of Demand
The reason that the demand of a product changes with price is due to three factors. These factors give the demand curve it’s slope.
- Swap or substitute to another product aka Substitution Effect
The cheaper a product is the harder it is to swap to a cheaper alternative. An example here would be a product that can be swapped out for the same effect. If the price of potatoes goes down relative to rice people will swap or substitute rice for potatoes as they are both starch based foods that can be used in a meal. You wouldn’t swap out eggs if potatoes got cheaper as they are not substitutional ‘swappable’ products. You get this effect in cars (imagine if Ferraris were the same price as a Ford) or with people (imagine if PhD students were the same price as a school leaver – this might not work in all industries).
In our chocolate example as the chocolate became more expensive a consumer may swap out chocolate for a biscuit or another treat. - Income effect
Your money can buy more when the product is cheaper. The most common examples of the income effect is the Sale or Special Offer. Imagine you’re doing your weekly shop and your favourite biscuits are on sale. Normally they are £ 1 a packet and you can afford on your income one packet a week. This week they are reduced to £ 0.50 (half price, 50% off!). With your £ 1 you can now afford to buy two packets – you demand 2 packets! However, there is bad news. A week later the biscuits have gone up to £ 1.01 – 1p over your budget. This is too expensive so you buy zero biscuits.
There are two tricks here that is used in marketing: 1) get people to try the product at a discount so they can experience and like it then increase the price hoping the customer swaps away from another purchase so can continue to purchase the discounted product. 2) Create a discount price to give the impression that the customer is saving money – a coat with 50% off is more appealing to a full price as the customer thinks they are getting a bargain however the full price was inflated in the first place.
In our chocolate example we may only be able to afford 1 bar if it’s priced at £8 but two bars at £4. - Law of Diminishing Marginal Utility
This sounds tricky as it’s in economy speak. But it’s super easy and logical and you may realise that you provide diminishing marginal utility to your relationships. Let’s break it down.
Diminish means to get small general over time e.g. that chocolate bar is diminishing as you eat it or the ice cube’s size diminished at melts.
Marginal is the difference between one thing and another like the margin on a page is the difference between the edge of the page and a border on a page. Or the difference between the benefit of the having one bottle of water to the second. More precisely marginal is the addition of something e.g the profit margin is the extra cost added to the product to make a profit.
Utility is the benefit or satisfaction that a consumer gets from having or using the product. If the consumer only has one then they prized it more (greater utility) than if they had two and so on.
Taking these three things together the more a consumer has of a product the lesser (diminished) additional (marginal) benefit (utility) they have. The marginal effect is one of the reasons for the shape of the demand curve. Some things people get huge value if they have one but significantly less if they have two or three.
In our example having one bar of chocolate available is a real treat. If we had 8 bars we wouldn’t want chocolate as much (that’s the theory and where chocolate may not be a good example!).
These three factors mean a consumer will want more of something if it gets cheaper (the cost of investing in more of something is less) and less if more expensive (swap to cheaper options, less income, less benefit).

Shifters of Demand (how demand changes price)
The three demand factors stated above define the curve shape (negative, sloping) but what makes the curve shift – move left or right or up or down. There are five main factors that shift demand all of which you should be aware of when you are designing your product and setting your price as demand can shift extremely quickly in and out of your.
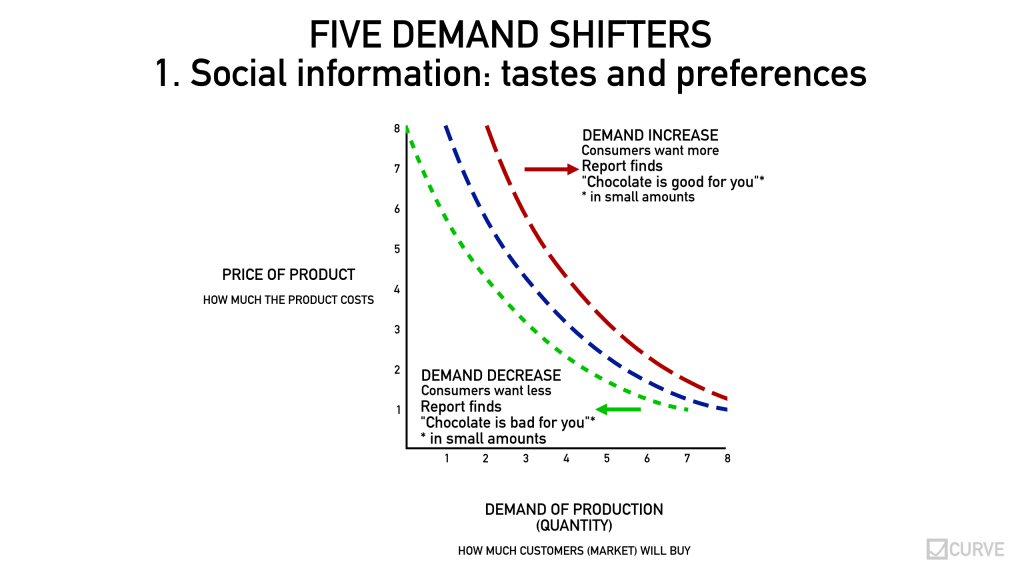
1. Tastes / Preferences (social and economic change)
People make decisions based on the information they have. This information People want more or less of something due to new information. The information can be formal like a change in a law or tax rate or can be social like gossip.
New study – “chocolate is good for you” – everyone will want more chocolate – demand goes up – curve moves to right
Diesel cars will be taxed higher – not as many people want one – demand goes down – curve moves to the left.
2. Number of consumers (population change)
The greater the number of consumers the greater the demand for products. More people equals more demand which means the demand curve moves the right. Less consumers does the opposite.
A good example of this is housing. When there are lots of people wanting housing house prices increase (move in). When the number of people drops (move away) the price of housing drops.

3. Price of Related Products
A key driver for demand is the ability for the consumer to switch or substitute to another product which has higher value (utility) and/or compliment to an existing product with an additional product.
Substitution is straight forward enough. When the price of one product reaches a point that is above that of a suitable substitute the customer will substitute the new product for the old one. For example if the price of Heinz Baked Beans reaches a point where it’s deemed too expensive compared to Franc Fried Beans the consumer will swap out (note: HBB doesn’t have to be cheaper just less valuable than the alternative).
A compliment adds value to an existing product or can change the product to have more value in another way. A compliment is not a component or an ingredient of a product. If we extend our baked bean example the demand for beans will increase if the demand for sausages increases probably due to price decrease. Compliments tend to come in sets or product families. If the demand for computers increase then the demand for printers, keyboards. monitors etc will increase. Things can also be tightly paired so that an increase in demand in one will see a strong demand to the compliment. Games for example that play on a device will strongly shift if there is a shift in demand of the device. Paired products can be seen as a form of compliment with the strength depending on how closely they are paired e.g. games on the Microsoft XBox will increase if there is an increased demand of Sony Playstation as both games can be played on both with shared players.

4. Level of Income
This is an easy one at the personal micro level and a bit more complicated at the national macro level. At the personal level the less money in people’s pockets means the less ability to buy things and less demand overall. The reason for the decrease in income can be personal (loss of job) or it could be national (increase in taxes). With national, macro changes the decrease/increase (higher/lower taxes) in demand can be divided into monetary policy commonly set by the central bank and fiscal policy set by government both local and national.
Monetary policy states how much money there is in circulation. Without getting too complicated the central bank can control the cost of currency. Currency is all the value the bank will guarantee. This includes cash in your pocket or bank plus other things like government bonds which are can be bought lending a government money with a guaranteed return). The primary reason for monetary policy is to control inflation. Inflation is where the price of goods increases due to more people having more money to buy things. This increase in cash pushes up prices as there is more money about in the same way a price increases at an auction. The other factor of inflation is for products that people have to buy like food, fuel and clothing. If the costs to produce these increase that cost is normally passed directly to the consumer pushing up the price. The monetary policy is to try and control demand so that people feel confident to buy things at stable prices. This done through the supply of money and the interest rate applied to it – the higher the interest the higher the return the less likely people will spend decreasing demand and vice versa.
Fiscal policy is one where the government sets tax rates on it’s population and businesses. These taxes will lower demand in the short term as it reduces the level of cash in the economy but it can boost demand if the money raised is spent helping the economy with respect to infrastructure, security (policing), transport and business subsidises. The fiscal policy will aim to provide a stream of revenue for the country but this is not easier as the country will have to balance need for immediate money to pay it’s daily expenses (wages of government workers, materials, rents etc) and the need for longer term investment in bigger projects against taxing too high that effects the level of private investment that comes from the profits generated from operating.
Before we leave income we need to explain two different type of products that demand is affected differently by changes income.
- Normal goods: income is directly and positively related to demand – income up = demand up.
- Inferior goods: income is inversely related to demand – income up = demand down.
This runs a little counter to what has just been said “income goes up – demand goes up”. Why do inferior goods increase when income goes down?
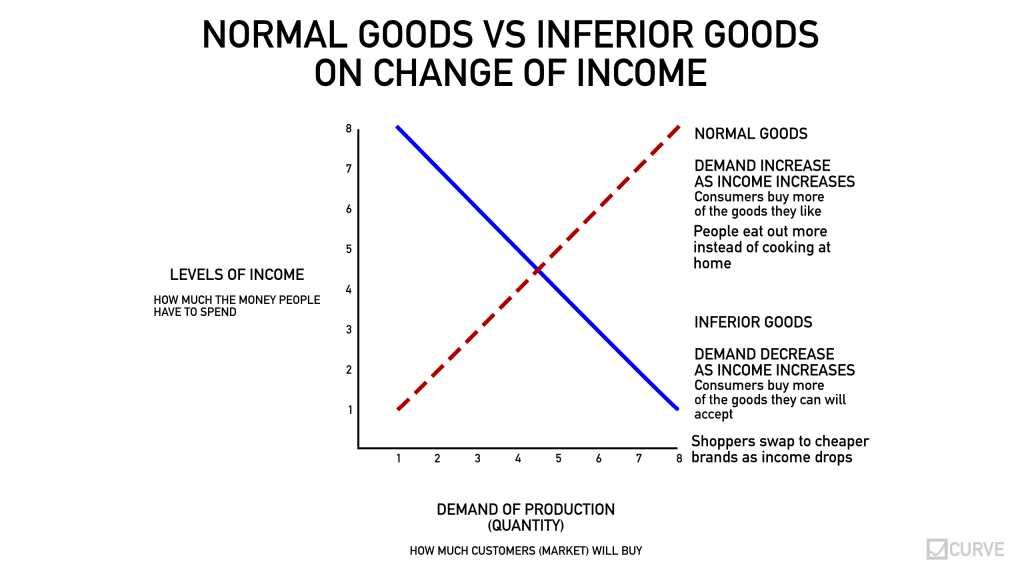
The normal goods vs inferior goods is a little, well, insulting but emotion has no place in economics. Normal goods are normal as they behave normally with respect to how they respond to changes to income. Inferior goods could be called abnormal goods but that’s even harsher than inferior. Inferior
Summary points are when a populations income drops demand goes down be that from personal loss of income or from changes to monetary of fiscal policy.

5. Expectations of change (price/availability)
The expectation of the price changing is exactly what it says – an expectation that something is going to change and that expectation changes the behaviour. The change in behaviour can be to hold back buying something until the thing they are expecting happens or it gets to a point where they can wait no longer so act. The expectation can be that prices will rise so demand will increase or vice versa with prices falling so lowering demand.
An excellent example of expectations and demands is at auctions. There are many types of auction but we can use the traditional auction which starts at low price and then bidders increase the price until there is a winning bidder. Here the expectation is to not bid early as this can increase price or doing the opposite by bidding early and high to put off other bidders. Another type of auction works the opposite way with the price starting high and then dropping until someone bids. This is known as a Dutch auction where the behaviour is to hold your nerve and hope that no one bids before you do dropping the price.

Rule 2
Businesses will only supply a product which has a customer demand
Rules 3
Businesses will only produce at a sustainable profit
Rule 4
An increase in price will decrease demand. A decrease in price will increase demand.
These four rules will help set a strategy for pricing a product that your business produces (includes services).
Rule 1 and Rule 2 – Market Supply and Demand
Rule 1 states the customer will always look to pay the lowest price. This is because the customer will have limited money and like a business will look to maximise the use of that money by only buying the lowest price or the cheapest product.
Rule 2 states that a business will only supply a product if a customer will pay for it. The purpose of the business is to generate profit (Rule 3) so making something that no one will buy is all cost and no profit therefore pointless. Remember being profit driven is essential for a business to remain on going .
As customers are only willing to pay the lowest price and businesses are only going to supply at a profit there is a point where the price a customer will pay meets the price the business is willing to sell at. Another way of putting this is a business will only supply to meet customer demand or, in a slightly economics terms
Customer will only pay at the minimum price (P) = market price
Businesses will only supply at price (P)
Supply of Product at market price = market supply
Market supply is the quantity (Q) of product supplied
Market Price = Market Supply = Market Demand = Quantity Produced
or
at Price (P) quantity (Q) is produced
Rule 3 and 4 – Maximise Profit through Maximising Market
So far so simple. Businesses supply things to a customer as certain price. This fundamental creates a force or dynamic tension between the price the business wants to set and the customer is willing to pay.
If we assume at this point that there is only one customer and only one business suppling the market we can see how changes in price effects customer demand
To make things a little more real let’s use chocolate as an example. You are now Maria the Chocolatier making mega chocolate bars.
You price your mega chocolate bars at £6 due to your costs and markup profit
Cocoa (chocolate) beans = £ 4.00
Sugar = £ 1.00
Other costs = £ 0.50
Total Costs = £ 5.50
To make a profit you have decided to add £ 0.50 profit for each bar.
Sale Price = Profit – Total Costs
£ 6 = £ 0.50 + £ 5.50
At this price there are 300 customers that want your chocolate bar.
300 customers x £ 0.50 = £ 150 profit.
Excellent. Things are good. You are making money at this basic level.
And we have more good news. Due to a bumper harvest of cocoa the price of cocoa has dropped from £ 4 to £ 1
Cocoa (chocolate) beans = £ 1.00 (reduction from £ 4)
Sugar = £ 1.00
Other costs = £ 0.50
Total Costs = £ 2.50
You’re not greedy so you keep your profit to £ 0.50 for each bar.
Sale Price = Profit – Total Costs
£ 3 = £ 0.50 + £ 2.50
With the dramatic drop in sale price more people can afford the chocolate bar (they wanted it before but not at the higher price). Now 600 people will buy the bar.
600 customers x £ 0.50 = £ 300 profit.
Super Excellent! Things are now great. More customers, more profit, happy days. This change in price and demand is illustrated below.

This model can be stated in the illustration graph below. Price goes up; demand (quantity supplied) goes down. Price goes down; demand goes up.
The tricky part of this is how to set your profit or, more specifically, how much you markup your product above cost. The amount you can markup a product depends on the elasticity of the demand.
Elastic and Inelastic Demand
The chocolate bar example above demonstrated how demand changes with a change is price along with a change in supply: the cheaper the chocolate bar the higher the demand the greater the supply.
When the price of a product changes the demand and supply the product can be said to be elastic. This dynamic between price and supply can define certain products or market conditions. Knowing these types of products and conditions will help you set your price for your product instead of just guessing.
% change is quantity (supply)
% change is price (demand)
he opposite
To define
There are five types of price elasticity
perfectly elastic, elastic, perfectly inelastic, inelastic, and unitary
- Perfectly Elastic
- Elastic
- Perfectly Inelastic
- Inelastic
- Unitary
Perfectly Elastic
A perfectly elastic product is one
Elastic
Inelastic
Perfectly Inelastic
Unitary
You may notice in the graph on the chocolate bar above that the line had a negative slope or gradient. The angle of this slope defines how
Before we get into how to
How much markup? Costs and Price

In a good competitive market where competing businesses can set their own price based on how they run their business it is possible for a business to create a cheaper product and take all the customers away from its competitors.
P
is, at first glance, obvious – why would a customer pay for a product when a cheaper (lower price) is available? For many products this is true with the most obvious examples ones that are largely invisible to others. Fuel (petrol, diesel, electricity) is the most common example. For other products price is not the only factor but we’ll look at the idea of additional value for the same product through ‘branding‘ later.
The
As a customer will only pay for the cheapest product producers will look to produce at the maximise price to gain the maximum profit. If a producer can produce at a cheaper cost then it can either keep the additional profit or it can lower its price to gain more customers. This is not common as maximising revenue through the highest price is the strongest strategy as a business can always cut it’s profits if it needs to but would struggle to put them up back up again (we’ll cover discounting or sales later).
The simpliest way to express the relationship
NERD CORNER
Branding was first started by the ancient Egyptians around 2,700 Before Common Era (BCE) or 4,500 years ago where they used would use a hot branding iron to identify livestock. Branding is the ability to create a recognised product via a specific marking.
